
Crisis Risk Is a Tail, Not the Base Case
A practical read for clients on UK debt sustainability, sterling risk, and what to watch next.
Click Here to Read the Full Version
Executive summary
Where we stand now
Stock and flow
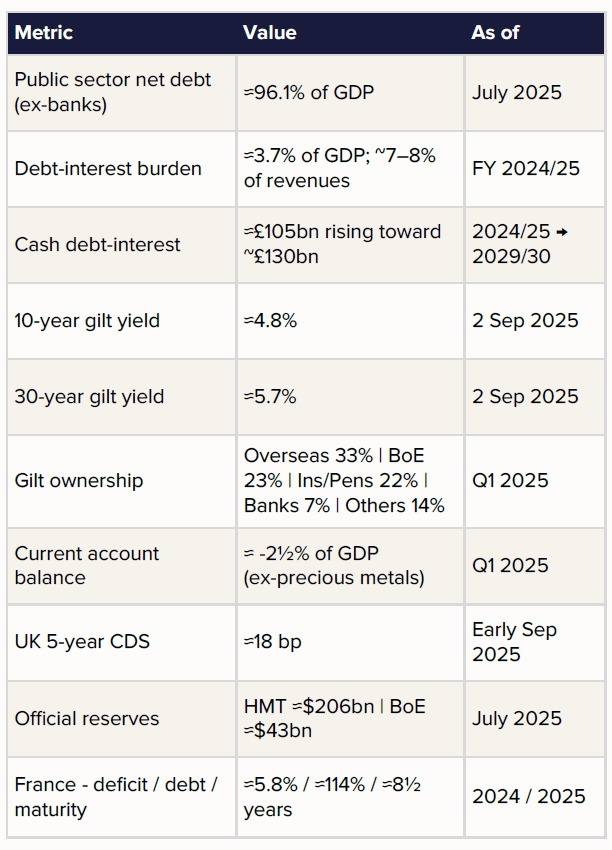
Debt: Public sector net debt (ex-banks) is approximately 96.1% of GDP (July). The medium‑term path is broadly flat on current projections.
Deficit & financing: The 2025/26 gross financing requirement remains heavy. The DMO has pencilled ~£299bn of gilt sales for 2025/26, with a somewhat greater reliance on T‑bills at the margin. Auctions are clearing, but at higher term premia.
Debt service: Debt‑interest outlays are ~3.7% of GDP and around 7–8% of revenues, roughly double the pre‑pandemic share. Cash costs in 2024/25 are about £105bn, rising toward ~£130bn by the end of the forecast horizon as the stock rolls.
Market rates and who holds the risk
Yields: 10‑year ~4.8%; 30‑year ~5.7%. The UK now faces the highest long‑term borrowing costs in the G7, largely due to sticky services inflation, heavy supply, and a thinner captive bid. 2 September 2025 (Dubai)
Chart 1: UK Gilt Yields

Ownership: Overseas investors ~33%; Bank of England ~23% (falling under QT); insurers & pensions ~22%; UK banks ~7%; other financials ~14%. The structural decline in the domestic lifer bid has lifted the term premium the state must pay.
Quantitative tightening: The APF gilt stock is shrinking (order of ~£100bn per year), removing a price‑insensitive buyer and returning duration risk to private balance sheets.
External accounts and buffers
Current account: The deficit is roughly 2½% of GDP (Q1, excluding precious metals) — funded, but a structural call on foreign capital remains.
Market risk gauges: UK 5‑year CDS prices near the high‑teens (~18 bp), consistent with low default risk. Official reserves are sizeable (HM Treasury c.$206bn; BoE c.$43bn, July).
Could this tip into a sterling crisis?
Possible, not probable. Sterling ‘runs’ materialise when macro fragility meets a loss of policy credibility and market plumbing breaks.
Today’s system is sturdier than during the 2022 LDI episode; policy signals remain orthodox. The tail risk rises, however, if three things happen together:
At present, none of these markers is flashing red.
When do gilt yields become a fiscal problem?
Use the OBR’s ready‑reckoner: a 100 bp parallel rise in gilt rates that persists adds roughly £12bn per year to debt‑interest by year five. On top of that, the structural loss of the pension/lifer bid likely adds around 80 bp to the term premium through the cycle, worth roughly £22bn per year on today’s debt stock. Translation: the pain threshold is cumulative. Sustained 10‑year yields above ~5¼% and 30‑year yields above ~6% would force either deeper spending restraint and/or tax rises, or changes to issuance mix and the QT pace.
1976 comparison (Healey’s IMF programme) — what’s similar, what’s not
Then: CPI had just run near 25%, sterling was sliding, credibility had evaporated, and reserves and market access were fragile. The UK sought a $3.9bn IMF loan and agreed to spending cuts; it ultimately drew only part of the facility and repaid by 1979.
Now: inflation is elevated but falling; the exchange rate is free‑floating; auctions are clearing; and the policy framework is broadly orthodox. The analogy flatters the past and misreads the present. Britain is not on the IMF’s doorstep, but higher real rates, ageing‑related spending, and a thinner captive bid mean policy errors would be punished more quickly than a decade ago.
France vs UK — who looks riskier to bondholders?
France: deficit around 5.8% of GDP in 2024; debt near 113–114% of GDP; average maturity roughly 8½ years; non‑resident share close to half of negotiable debt. Euro‑area backstops (PEPP reinvestments, TPI) temper tail risks to yields, though political noise and EU fiscal rules add pressures of their own.
UK: longer average maturity (around 14 years on an uplifted‑nominal basis) and monetary sovereignty confer flexibility, but the term premium has risen as the BoE and pensions reduced holdings. Net: France’s flow problem is worse; the UK’s market‑structure problem is trickier.
What to watch next (actionable signals)
House view & portfolio implications
Base case: no crisis, but a higher‑for‑longer long end and episodic volatility while the UK replaces captive buyers with more price‑sensitive ones.
Rates: prefer the belly over ultra‑longs; keep dry powder for tail‑driven dislocations (e.g., 30‑year >6% alongside auction strain).
FX: sterling’s cyclicals beta remains high; hedge GBP around data‑heavy weeks and fiscal events.
Credit: UK IG credit remains attractive versus ultra‑long gilts at equal duration; monitor sovereign CDS for regime shifts.
Sources & methodology
Figures are compiled from official publications including the ONS Public Sector Finances, the OBR Economic & Fiscal Outlook and Fiscal Risks reports, the UK DMO Quarterly Reviews and remit updates, HM Treasury Official Reserves statistics, the Bank of England APF/QT disclosures, and IMF/ECB/AFT releases. Market levels reflect mainstream data vendors as at 2 September 2025. All estimates are GCIO calculations unless stated.
Gary Dugan – Investment Committee Member
Bill O’Neill – Non-Executive Director & Investor Committee Chairman
3rd September 2025
The information contained within is for educational and informational purposes ONLY. It is not intended nor should it be considered an invitation or inducement to buy or sell a security or securities noted within nor should it be viewed as a communication intended to persuade or incite you to buy or sell security or securities noted within. Any commentary provided is the opinion of the author and should not be considered a personalised recommendation. The information contained within should not be a person’s sole basis for making an investment decision. Please contact your financial professional at Falco Private Wealth before making an investment decision. Falco Private Wealth are Authorised and Regulated by the Financial Conduct Authority. Registered in England: 11073543 at Millhouse, 32-38 East Street, Rochford, Essex SS4 1DB