
Click Here to Read the Full Version
The March 2026 US CPI confirmed what we have been anticipating: the inflation shock is real, it is supply-driven, and it has barely started. At 3.3% year-on-year, the March print represents the visible first layer of a multi-round repricing that will move through freight, food, and services over the coming quarters.
Unlike demand-driven inflation, this cannot be resolved by raising interest rates, only transferred into growth destruction and the Fed faces that choice while carrying $39 trillion in debt, at a time when interest payments already consume 15 cents of every dollar it spends. The discussion among commentators has framed the implications as structural rather than tactical, with attention to real versus nominal assets.
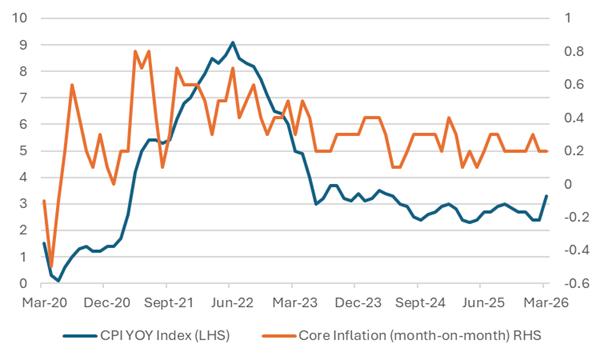
The release of the March 2026 US Consumer Price Index (CPI) inflation report last week marks the moment when the inflation risk we have been tracking moves from forecast to a confirmed fact. The headline rate jumped to 3.3% year-on-year in March from 2.4% in February, a single-month acceleration of the kind that does not happen in an economy where price pressures are under control. In fact, the monthly reading of 0.9% was the largest since June 2022, when the post-Ukraine inflation surge was running at full force. Markets chose to anchor on the core reading, which came in marginally below consensus, and found in it a measure of comfort. This week we examine why some commentators view that comfort as potentially premature and why the March data, striking as it is, represents the opening episode of a shock whose full magnitude has not yet come close to being reflected in any official data series.
Chart 1: US Core and Headline CPI
Source: Bloomberg
The headline numbers are stark. The Consumer Price Index for All Urban Consumers rose 0.9% in March on a seasonally adjusted basis and 3.3% over the last 12 months. The index for all items less food and energy increased 0.2% in March and is up 2.6% over the year.
The driver of this increase is unambiguous. The energy index surged 10.9% in March, led by a 21.2% jump in gasoline prices, which alone accounted for nearly three-quarters of the entire monthly rise in the all-items index. Shelter continued its grind higher. The shelter index is up 3.0% over the past year. Airline fares are up 14.9%, already reflecting the pass-through of energy costs into transport. Household furnishings and operations are 4.0% higher over the year, and medical care is up 3.1%. Used cars and trucks provided a modest offset, falling 0.4% in the month, as did personal care. These offsets helped contain the core reading to 0.2% monthly and 2.6% annually, marginally below the consensus of 0.3% and 2.7%, respectively. This is the number that markets chose to celebrate.
The Iran conflict, which disrupted energy flows through the Strait of Hormuz, began on 28 February. March’s CPI, therefore, captures barely one month of elevated oil prices beginning to filter through a cost structure that processes energy inputs with lags of one to three quarters. March represents the immediate, visible surface of the shock: petrol, utilities, airfares, the categories directly priced off energy. What we have not yet seen is the second layer: the impact on road freight, cold-chain logistics, fertiliser costs, packaging, chemicals, cement, steel, and food production. These categories move more slowly. The April, May, and June prints, therefore, will push core CPI higher even if energy prices stabilise from here.
Core CPI is structurally a lagging indicator of headline CPI. When a headline shock is severe enough and sustained enough, it migrates into core over subsequent quarters. We are in the early stages of that migration. April will be the first full calendar month of the war’s effect on prices, the March data covered only the final two weeks of February’s disruption and one month of its consequences. Should the ceasefire hold and oil stabilise, the April print is still expected to be elevated. Should the ceasefire deteriorate and oil move back toward $110, the April figure could be materially higher.
And that is before we account for the pre-existing inflationary pressures that were yet to be resolved before the geopolitical shock arrived. Even before 28 February, core PCE, the Fed’s preferred measure of inflation. was running at 3% in February, a full percentage point above the US Central Bank’s 2% target. Shelter costs were elevated. Healthcare was rising. Tariff effects were still filtering through the goods side of the economy. The Iran shock has landed on top of an inflation problem that was not finished. It has not created the problem from nothing; it has accelerated and extended it.
This distinction is the one we want readers to hold onto, because it determines both how long this lasts and how little the conventional policy toolkit can do about it.
The standard inflationary episode, too many dollars chasing too few goods because an economy has run too hot is, in principle, manageable. Raise rates, tighten credit, cool demand, and inflation subsides.
Supply-side inflation operates differently. You cannot raise interest rates back into existence because the fertiliser cannot be shipped through the Strait of Hormuz. Urea is urea. Nitrogen is nitrogen. The farmer lacks a substitute. The cargo that is not moving through a military blockade does not rematerialise because the Fed holds rates at 3.75%. Tightening monetary policy in a supply-shock environment does not solve the inflation problem. Instead, it transfers the pain from price inflation to growth destruction. It suppresses demand to meet reduced supply, instead of fixing supply to meet existing demand. That is a very different and much more costly outcome for the economy, and it is not clear the Fed has the appetite for it, given the current fiscal constraints.
The oil crisis of 1973–74 is instructive, and it is more relevant in the current scenario than almost any other historical comparison. The OPEC embargo of October 1973 did not simply raise petrol prices; it cascaded through the entire cost structure of an industrial economy that had not yet understood how thoroughly energy was embedded in everything it produced. Farmers faced higher diesel and fertiliser costs simultaneously. Manufacturers faced higher energy bills. Transport became more expensive. Food followed. Services followed food. US inflation did not peak until 1974, when it had reached double digits, because the shock moved in waves that took time to propagate through the system.
The architecture of vulnerability that we see today maps closely onto that experience. A supply shock on a critical energy corridor, radiating outward through a complex, interdependent global production network, arriving at a moment when the previous inflationary episode had not been fully resolved, and when central bank credibility was already stretched.
The Federal Reserve minutes released earlier last week showed that some officials already raising the possibility of rate increases if inflation continues to run above target. This represents a meaningful shift in tone. For most of the past year, the conversation has been about when to cut, not whether to hike. To understand why that prospect is so alarming, the arithmetic of the federal balance sheet needs to be understood.
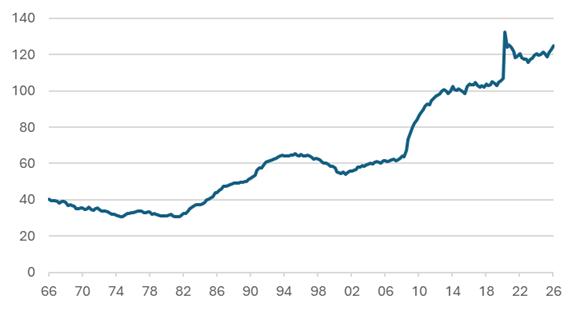
US gross federal debt has now crossed $39 trillion, with debt-to-GDP at approximately 125% compared with just 23% when the OPEC shock struck in 1974. The average interest cost on that stock sits around 2.55% still heavily suppressed by the enormous volume of near-zero-rate bonds issued between 2010 and 2022. Even at that artificially low average rate, net interest payments on the national debt crossed $1 trillion for the first time in history in FY2025, making debt servicing the third-largest item in the federal budget behind only Social Security and Medicare, consuming nearly 15 cents of every dollar the government spends, against a 50-year historical average of under 9 cents. That $1 trillion produces nothing: no defence, no healthcare, no infrastructure. It is the pure cost of the past.
Chart 2: US Government Debt-to-GDP (%)
Source: Bloomberg
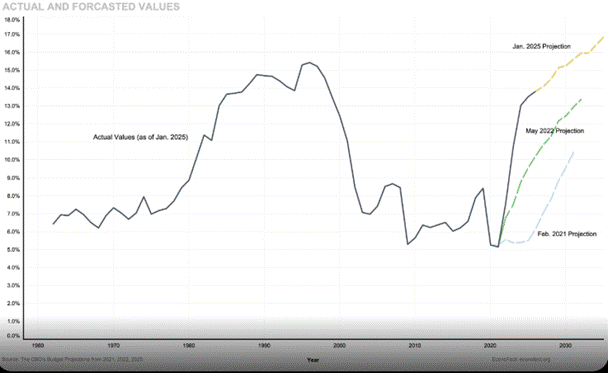
Now consider what happens as that debt stock matures and is refinanced. Every bond originally issued at near-zero rates that rolls over at today’s rates of 4% or above locks in a permanently higher coupon on a larger and larger principal. The CBO already projects interest payments rising to $1.8 trillion annually by 2035, faster growth than any other category in the federal budget, surpassing defence spending within this decade. And those projections were constructed before last week’s inflation data, before the Iran shock began to propagate through the system, and before the question of rate hikes was back on the table.
Chart 3: Interest Payment as a Percentage of Government Spending
Source: Office of Management and Budget
This is where impossible choices come into the picture. Cutting rates risks accelerating the inflation that is already running well above target. Holding rates high means every maturing bond is refinanced at current rates rather than the near-zero coupons at which much of it was originally issued, a slow but relentless upward ratchet in the average cost of servicing $39 trillion that compounds automatically, independent of any new borrowing. Raising rates into a slowing, over-leveraged economy risks triggering the credit dislocation that the entire normalisation cycle was supposed to avoid. Paul Volcker could raise rates to 20% in 1979 because the federal government, carrying a debt-to-GDP of 23%, could absorb the consequences. That option does not exist today.
Beyond the immediate shock, there is a structural argument for persistently higher inflation that most conventional asset allocation frameworks have not yet absorbed. The global population is now approaching 8.2 billion, with a decisive shift underway in its composition. Asia and Africa represent the largest concentrations of young, aspiring populations in human history. As these populations become wealth-enabled, gaining access to protein-rich diets, manufactured goods, personal transport, healthcare, and energy-intensive lifestyles, the aggregate pressure on the planet’s finite reserves of food, water, arable land, hydrocarbons, and industrial metals will rise structurally and persistently.
This is not a cyclical demand pulse that monetary policy can smooth away. It is a secular repricing of the physical world. The West’s four-decade experience of cheap manufactured goods, anchored by Chinese labour costs and extraordinary supply-chain efficiency, is in structural retreat as Asia’s domestic consumption grows and wages rise. That disinflationary tailwind does not simply slow, it reverses. Once inflation expectations shift, they are self-reinforcing in a way that takes years, not months, to unwind.
The investment response to a structurally inflationary world is not complicated in principle, even when it requires courage in execution. In a world where the price level is structurally higher, the core principle is to own things rather than promises. Financial assets, particularly long-duration bonds, are explicit commitments to receive a future nominal sum, and that sum loses real value as inflation persists and compounds. Real assets reprice with inflation or ahead of it.
Within that framework, several themes sharpen. Commodities (agriculture, energy, and industrial metals) are frequently cited by commentators as a direct expression of supply-constrained inflation, and this week’s data is viewed by many as supportive of that thesis. Agricultural land in stable jurisdictions such as Australia, New Zealand, Brazil and parts of Central Europe is often referenced in inflation-linked discussions for its scarcity and linkage characteristics. Infrastructure assets such as ports, rail, utilities and toll roads commonly feature revenue structures with inflation escalators, which commentators note as relevant in inflationary regimes. Real estate remains compelling selectively: logistics and industrial property benefiting from supply-chain reconfiguration, and residential assets in structurally undersupplied urban markets, are substantially preferable to office-heavy portfolios still adjusting to structural shifts in working patterns.
Supply-side inflation is not transitory in the way demand-side inflation can be. The former embeds itself in contracts, in wages, in expectations, and in the cost structures of entire industries. It rewards owners of physical assets and punishes holders of fixed-rate financial promises. The present environment, a confluence of geopolitical supply disruption, structural tariff barriers, demographic-driven demand growth across a wealth-enabling developing world, and a fiscal position that severely limits the Fed’s room to manoeuvre, is more akin to 1974 than 2021–22.
The question for portfolios is not whether inflation remains elevated in the near term. Last week’s data confirms it will. The deeper question is whether investors are adequately positioned for a world in which the long disinflationary tailwind of the past four decades has permanently reversed course. The weight of evidence, structural, geopolitical, demographic, and now empirically confirmed, says that it has. Real assets are not.
Gary Dugan – Investment Committee Member
Bill O’Neill – Non-Executive Director & Investor Committee Chairman
13th April 2026
The information contained within is for educational and informational purposes ONLY. It is not intended nor should it be considered an invitation or inducement to buy or sell a security or securities noted within nor should it be viewed as a communication intended to persuade or incite you to buy or sell security or securities noted within. Any commentary provided is the opinion of the author and should not be considered a personalised recommendation. The information contained within should not be a person’s sole basis for making an investment decision. Please contact your financial professional at Falco Private Wealth before making an investment decision. Falco Private Wealth are Authorised and Regulated by the Financial Conduct Authority. Registered in England: 11073543 at Millhouse, 32-38 East Street, Rochford, Essex SS4 1DB