
Click Here to Read the Full Version
Before anything else about market psychology or diplomatic signalling warrants attention, the physical facts of the ongoing disruption deserve to stand on their own. They are extraordinary, and any analysis that blurs or minimises them is starting from a false position.
Tanker transits through the Strait of Hormuz last week were 90% below traffic levels before the US and Israel attacked Iran, according to shipping data. Before the war, approximately 138 vessels transited the Strait daily. By the second week of April, the number had collapsed to single digits on many days, with only six confirmed transits on one Monday, following a blockade announcement the prior Sunday. That is not a mere traffic slowdown. It is a near-total stoppage of the world’s most critical energy chokepoint.
The International Energy Agency (IEA) has since issued language it has never used before. It stated that “resuming flows through the Strait of Hormuz remains the single most important variable in easing the pressure on energy supplies, prices, and the global economy.” That is not routine diplomatic boilerplate. The IEA was created in 1974 specifically to manage oil crises. It has activated its collective emergency stock release mechanism only six times in its 50-year history, and the language it has deployed since late March, calling the current episode the ‘greatest global energy security challenge in history’ is, by the IEA’s own standards, a five-alarm warning.
The magnitude of the current crisis becomes clearer against historical benchmarks. In 1973, embargoed countries faced a combined shortage of 4.5 million barrels of oil per day (mb/d), about 7% of the global supply at the time. The Iranian Revolution of 1979 reduced global supply by approximately 4%. In March 2026, global oil supply plummeted by 10.1 mb/d to 97 mb/d in March 2026, with continued attacks on energy infrastructure and ongoing restrictions on tanker movements, constituting the largest disruption in recorded history. The IEA assessed that flows through Hormuz collapsed from 20 mb/d to a trickle, with Gulf production cuts of at least 10 mb/d.
The 1973 shock produced a 300% oil price increase and restructured global energy policy for a generation. The current disruption is physically at least four times larger, affecting roughly three times the percentage of global supply.
The IEA itself stated on 7 April that the oil and gas crisis surpasses the combined severity of the 1973 Arab Oil Embargo, the 1979 Iranian Revolution, and the 2022 Russia-Ukraine supply shock. This is the context inside which statements about ‘limited reopening’ and ‘market normalisation’ need to be evaluated.
The divergence between paper prices and physical reality has been one of the most analytically important features of this crisis, and one of the most consistently underweight in general market commentary.
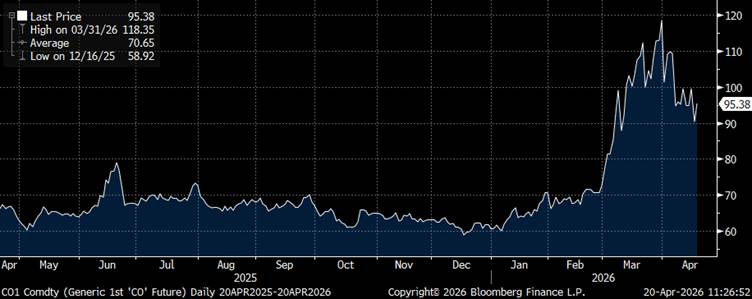
Brent crude futures prices rose 36% from 27 February, the last trading day before the war started, through 27 March, when they traded above $113 a barrel. But the Dubai price, which tracks physical delivery from certain Middle East sellers, rose 76% more than twice the paper price to $126. Physical crude prices surged to record levels near $150 per barrel, far above the prices in futures markets, with the physical futures disconnect becoming increasingly acute. Even steeper gains were seen in refined products, with middle distillate prices in Singapore reaching all-time highs above $290 per barrel.
Chart 1: Brent futures prices don’t tell the complete picture
Source: Bloomberg
The mechanism here matters. A futures price is a probability-weighted bet on where clearing prices will land at a future date. It can be, and regularly is, suppressed by presidential rhetoric promising an imminent resolution. A physical price is a statement by a buyer who needs actual barrels today and cannot wait for diplomatic breakthroughs that may not materialise. Traders describe this as ‘jawboning’ the rhetoric working to prevent bigger paper-market reactions but, as Chevron CEO Mike Wirth noted, “There are very real, physical manifestations of the closure of the Strait of Hormuz that are working their way around the world.”
The IEA’s April report provides a second physical confirmation. Crude oil stocks in importing countries in Asia dropped by 31 million barrels in March, with further declines expected in April. Asian petrochemical producers curtailed operating rates as feedstock supply dried up. Flight cancellations across the Middle East and parts of Asia and Europe led to a sharp drop in jet fuel consumption. That last data point, flight cancellations, is the kind of concrete physical manifestation that tends to appear in airline earnings calls about six to eight weeks before it registers in consumer confidence surveys and labour market data. We are still well inside that lag window.
The emergency release of strategic petroleum reserves has been treated in many quarters as evidence that policy still has effective tools at its disposal. The arithmetic does not support that confidence, however.
More than 30 nations agreed to flood the market with 400 million barrels of oil, the largest release of stockpiled crude in the 50-year history of the IEA. The US led the effort by releasing 172 million barrels from its Strategic Petroleum Reserve, representing 41% of what it currently holds. That sounds large. Against the actual disruption, it is not. JPMorgan Commodities Research found the coordinated release amounts to about 1.2 mb/d, about what the system can manage, but that is insufficient to counter the potential loss of roughly 12 mb/d from a prolonged Hormuz shutdown. The market delivered a clear verdict: crude prices surged more than 17% in the days after the IEA announced the emergency release.
One analysis drew out the structural inadequacy with unusual precision: in every previous crisis, the IEA released enough oil to cover the disruption for weeks or months, buying time for production to recover. In 2026, the coverage ratio collapsed to 50 days because the disruption is four to five times larger than anything the system was designed to handle. The Hormuz closure is not a leak in the global oil pipeline. It is the pipe itself being cut.
There is also a legacy problem that cannot be avoided. The US reserve reached its peak of 726.6 million barrels in 2009. It entered the Iran war at approximately 415 million barrels, 57% of its authorised capacity. The Biden administration’s 2022 release drew down reserves that were never fully replenished. A tool that was already partly depleted is now being deployed against a shock four times the size of any crisis it was originally designed for. The signalling value may be real. The physical math is not.
India’s strategic reserve, approximately 39 million barrels, covering just over seven days of total consumption is essentially irrelevant as a buffer. The 2026 disruption falls hardest on Asia, where 80% of Hormuz-transiting oil was destined, and the buffer capacity there is thinnest.
The 1973 comparison is the most frequently reached for, and it is partially right but structurally misleading in several specific ways that deserve explanation.
What is analogous to 1973
A geopolitical trigger; Middle Eastern oil supply disruption; an immediate price shock; the beginning of demand destruction; supply-driven inflation arriving at a moment when governments are already fiscally stretched; central banks caught between growth protection and inflation control.
What is different and more severe
The 1973 embargo was a demand-side instrument producing countries chose to cut supply. It was reversible by political negotiation, and it was reversed in March 1974. The 2026 conflict has produced a physical chokepoint: unlike sanctions-driven disruptions, a sustained blocking of the Strait obstructs not only trade routes but the very ability of producers to export, pushing markets beyond adjustment mechanisms into forced demand destruction and structural reconfiguration. In 1973, neighbouring producers including, ironically, Iran, increased their output to fill the gap. In 2026, the most vulnerable economies are the developing Asian markets whose 80% of oil imports pass through Hormuz. The geography of exposure has inverted over 50 years of globalisation.
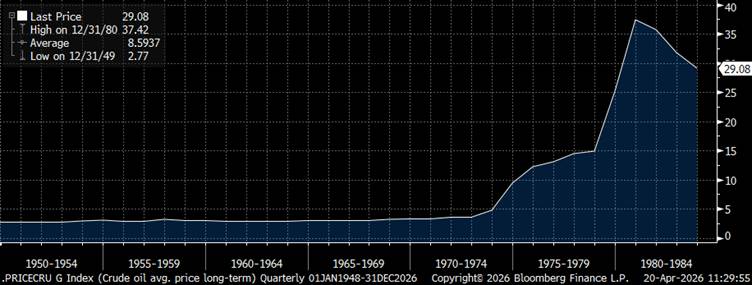
The 1979 comparison, the Iranian Revolution is in some ways more instructive. A 4% reduction in global supply drove crude prices up by 250% over 12 months. Oil prices did not return to pre-crisis levels until the mid-1980s. That was with a relatively contained disruption. The current shock involves 10.1 mb/d from a single closure event. It is worth asking what recovery timeline a disruption four times that size implies, and whether commentators making three-month horizon forecasts have properly stress-tested that question.
Chart 2: Historical price of oil through the 1970’s crisis and into the early ‘80s.
Source: Bloomberg
The 2022 Russia-Ukraine comparison is the most emotionally proximate template and the one most likely to breed false comfort.
In 2022, the global energy system demonstrated the capacity to absorb price shocks through rerouting, substitution, and policy intervention. The 2026 war exposed a fundamental vulnerability: the physical concentration of hydrocarbon flows in critical chokepoints, which cannot be compensated for when a closure occurs. Tools used in 2022 diversification and rerouting do not address a physical blockade of the world’s primary oil transit point. Rerouting around Hormuz requires going around the Cape of Good Hope, adding roughly 4,000 miles and 10-14 days to the journey, compounding insurance costs that had already moved to 0.4% from 0.125% of ship value per transit before the first strike.
The 2022 comparison omits a critical policy difference. In 2022, central banks still had room to raise rates aggressively. The Fed did raise them, inflation was brought down, and the energy shock was absorbed over roughly 18 months. That option is materially more constrained today.
Here is the argument that deserves the hardest treatment: the COVID comparison is not simply inapplicable in degree. It is inapplicable structurally, too. The tools that allowed governments and central banks to absorb the COVID shock do not exist in the same form today, and several have been actively depleted since 2020.
COVID was a demand shock. When economies shut down, central banks could lower rates, governments could borrow and spend, and the primary shock of damage, the collapse of household and business cash flows, could be mitigated by transfer payments and loan guarantees. It was fiscally costly but conceptually straightforward: to keep people and businesses afloat until the shock passed.
The 2026 Hormuz crisis is a supply shock. The oil is not there. You cannot simply boost tanker capacity. You cannot quantitatively ease your way to a barrel of North Sea Forties. Transfer payments to households do not unclog a naval blockade.
More critically, the conditions that allowed the 2020 COVID response to work have been systematically depleted. Total global debt levels in 2025 rose at the fastest pace since the pandemic surge, to a record $348 trillion more than three times the global GDP. The IMF notes that “very few governments are in a position to roll out a new stimulus.” The US national debt surpassed $39 trillion in March 2026, with the federal deficit running at approximately $1.78 trillion in the prior fiscal year. With interest payments on US government debt now exceeding even military spending, the government is borrowing to finance this war at higher rates, on a much larger debt base than at any previous point of comparable military engagement. A Harvard Kennedy School analysis estimates the total cost of the Iran war could reach $1 trillion when munitions replenishment, long-term care, and interest on war borrowing are included.
The IMF Deputy Director for Fiscal Affairs stated plainly that governments “have much less fiscal space, room for manoeuvre.” Global public debt is projected to rise to 99% of GDP by 2028. In a severe scenario, debt could reach 121% within the three subsequent years, a number that should cause pause in anyone reaching for a COVID-style stimulus as the solution to the next shock.
The central bank side of the constraint is equally binding but works differently. US CPI rose to 3.3% in March 2026, the highest in nearly two years, driven by energy costs. The Fed maintained rates at 3.5% to 3.75% and pencilled in just one cut for 2026. A Fed that was already on hold, watching inflation sitting above its 2% target, is now in a genuine bind: cutting rates to support a slowing economy risks embedding higher energy costs into broader price levels; holding or raising rates risks tipping a supply-shocked economy into recession. The ECB faces what its own economists call a ‘genuine dilemma,’ as an oil shock pushes already sticky inflation higher while the growth outlook weakens.
The conditions that made aggressive rate hikes effective in 1979, low public debt and a credible, independent Federal Reserve have substantially eroded since. Rate hikes today would risk triggering recession and financial instability, making them a 1970s remedy that contemporary balance sheets are ill-equipped to absorb. The IMF’s severe scenario makes this concrete: prolonged conflict implies global growth collapsing to 2% and inflation hitting 6.1%. A 2% global growth rate is the threshold below which the IMF conventionally classifies conditions as a global recession. Combined with 6.1% inflation, that is stagflation: the one combination for which every available policy tool simultaneously makes at least one of the two problems worse.
The fertiliser dimension of this crisis deserves more analytical real estate than it has received. It is not a footnote to an oil story. It is a separate, structurally significant shock with its own transmission mechanism and its own delayed-onset characteristics, which is precisely why it is not yet visible in consumer price data.
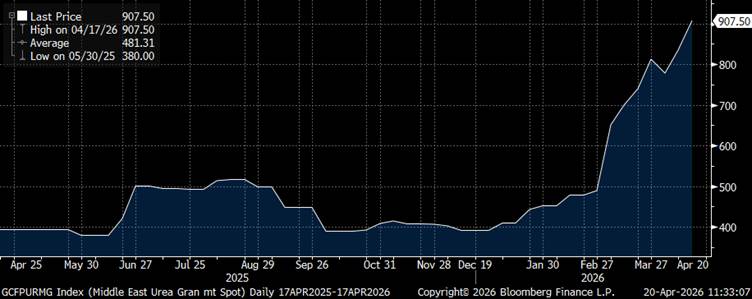
Nearly half of the world’s traded urea and large volumes of other fertilisers are exported from Gulf countries via the Strait of Hormuz. The conflict has restricted approximately 30% of the global urea trade, according to CRU Group. Urea export prices from the Middle East have surged by approximately 87%, rising to over $900 per metric tonne from under $500. Urea and ammonia prices have risen by around 50% and 20%, respectively, since the war began. Other fertilisers, potash, sulfur, phosphate have also risen in double digits.
Chart 3: Middle East Urea prices per metric tonne
Source: Bloomberg
The timing is what makes this particularly difficult to manage. Fertilisers are applied just before or during planting season. The Northern Hemisphere planting season is underway now. As one agricultural engineer managing a farm outside Berlin noted: “Our crops out in the field need nitrogen now, the sooner the better, so they can get off to a good start.” The USDA’s Prospective Planting report estimated that in 2026, plantings of corn and wheat acreage, both nitrogen-fertiliser-intensive crops, will fall 3% each relative to 2025. Ethiopia gets over 90% of its nitrogen fertiliser from the Gulf through Djibouti. A food systems economist at the University of Texas put it simply: “The planting season is now. The fertiliser isn’t there.”
The World Food Programme warns that if oil prices remain above $100 per barrel through June, the number of people facing acute hunger could increase by 45 million. The US is already approximately 25% short of fertiliser supply for this time of the year. That has a delayed transmission: it appears in crop yields at harvest, in grain prices six months from now, and in the global food system in 2027.
The comparison is instructive. When Russia invaded Ukraine in 2022, the combined disruption to potash and nitrogen fertilisers was severe. The current crisis adds the simultaneous disruption of Saudi Arabia, Qatar, Kuwait, the UAE, and Iran as fertiliser exporters. As the global head of fertiliser pricing at Argus Media noted: “It’s very significant and more significant in some ways than the impact of Ukraine because it is affecting multiple producers. You’re not just talking about one or two.” Even after the war ends, producers in the Gulf will require clear security guarantees before resuming shipments, and insurance costs will almost certainly remain elevated. The disruption has a tail regardless of how the conflict evolves.
The preceding analysis is broadly defensible on the data. Two specific argumentative moves, however, deserve scrutiny.
The GFC comparison
The analogy with the run-up to the 2007-2008 global financial crisis is rhetorically powerful but imprecise. The GFC was an endogenous financial crisis, it originated inside the banking system, in the mispricing of credit risk. Its defining characteristic was that the crisis began in finance and spread to the real economy. The current shock is the opposite: it originates in the physical world and is transmitted into financial markets. The GFC analogy works as a warning about complacency and delayed recognition, but it risks implying the mechanism of contagion will be financial sector fragility, when the primary risk here is physical supply disruption producing real-economy damage that eventually forces financial restatement. The analogy should be deployed carefully and with that explicit distinction.
On consumer resilience as an illusion
The treatment of consumer resilience as a lagging indicator is broadly correct. However, the IMF’s baseline before the severe scenario still projects US growth of 2.3% in 2026, the strongest of any major advanced economy. The honest version of the argument is not that consumer resilience is illusory, but that it is real in the near term and structurally fragile in the medium term. The distinction matters for credibility. Overstating the immediacy of consumer pain weakens the case for the more important point, which is that the medium-term transmission channels, through food prices, fuel costs, and employment lag, are already loaded and will discharge over the next two to four quarters regardless of what diplomatic headlines say next week.
The CFTC investigation
A Financial Times investigation found that $580 million in bets on falling oil prices were placed just 15 minutes before a presidential statement on 23 March caused a temporary drop in prices. This is a factual, reported event. It is reasonable to note as evidence that price discovery is operating in what appears to be a compromised information environment. The analytical point is calibrated: it tells us that political signals are being traded on before they are public, which makes futures prices less reliable as information aggregators. It does not tell us directionally where prices are headed, and should not be presented as if it does.
There is something worth making explicit about the generational and institutional pressures producing the ‘premature closure’ narrative in markets.
A significant proportion of the analysts now writing on this crisis came of professional age during or after the post-2008 era, in which the dominant policy response to any major shock was some combination of monetary easing and fiscal stimulus.
COVID was the apotheosis of that model: an enormous shock met with an enormous, coordinated, ultimately effective policy response. Central banks cut rates to zero. Governments spent without restraint. Asset prices eventually recovered and, in many cases, exceeded pre-crisis levels. The analytical lesson absorbed from that episode, absorb the psychological shock, trust the policy response, buy the dip, is deeply embedded in how a cohort of market participants now processes bad news.
That lesson does not transfer to the current situation, for structural reasons already set out above. But there is a further, institutional dimension. Banks need flow. Asset managers need subscriptions. Brokers need activity. The system has strong built-in incentives to interpret every setback as a buying opportunity and every ceasefire headline as a durable turning point. That is not a conspiracy, it is the natural output of an industry whose commercial model requires constructive positioning. The problem arises when it is mistaken for analysis.
This crisis also lacks what COVID had: an identifiable end state, vaccines against which progress could be measured. A vaccine is a quantifiable outcome. ‘Diplomatic resolution’ of a conflict involving Iran, Israel, the United States, and multiple Gulf states, against a backdrop of Iranian missile capability, a naval blockade, a shipping corridor controlled by Iranian Revolutionary Guard Corps (IRGC), and a US domestic political environment that has shown little appetite for de-escalation, presents a timeline that cannot be pulled forward by a presidential tweet.
COVID borrowed from the future. So did the response to the 2022 Ukraine shock. The 2026 crisis arrives against a balance sheet that has twice been drawn upon without full replenishment. The playbook does not reload automatically.
The IMF head said it plainly: the world was “facing this shock after it has been sustaining the impact of COVID, of the war in Ukraine, in other words, with depleted policy space.” That depletion is not rhetorical. It is a quantitative constraint visible in debt-to-GDP ratios, reserve levels, central bank balance sheets, and fiscal deficit trajectories. The analytical failure is treating a depleted toolkit as if it were still full, because it was full the last time it was needed.
Market commentary tends to read diplomatic statements without placing them against the military backdrop. A brief review of the operational situation is warranted.
As of mid-April, more than 10,000 US sailors, Marines, and airmen are part of the effort to blockade ships visiting Iranian ports, according to CENTCOM. Marines aboard three amphibious warships are trained in maritime visit, board, search, and seizure, and Navy SEALs are set to take control of ships if needed. The USS George H.W. Bush carrier group and the Boxer Amphibious Ready Group are either present or inbound to the theatre, representing approximately 10,200 additional personnel.
On 8 April, the IRGC issued a proposed Hormuz traffic separation scheme requiring vessels to coordinate with the IRGC Navy and warned of anti-ship mines in the main traffic lane. Between 6 April and mid-April, 50 out of 72 tracked transits used this IRGC-designated route, meaning vessels were providing documentation and in some cases payment to the organisation the US has designated a terrorist entity. The US has not yet determined whether transiting via this IRGC toll route constitutes sufficient aid to the Iranian regime to fall under the terms of the blockade. That single unresolved legal and operational question contains the seeds of a significant escalation event.
In other words, the Strait has not reopened in any conventional sense. What exists is a contested, partially managed, IRGC-supervised corridor through which certain politically approved vessels can transit by paying a toll to the IRGC, while the US Navy simultaneously asserts authority over the same waterway. Two sovereign powers are simultaneously claiming enforcement jurisdiction over the same maritime chokepoint. That is not normalisation. It is a controlled confrontation with potential for further escalation.
The IMF scenario framework is worth quoting precisely because it sets out the probable range of outcomes more honestly than most market commentaries do. The baseline projection is for global growth to decline to 3.1% in 2026, down from 3.4% earlier, and for global inflation to surge to 4.4%. In the severe scenario, prolonged conflict, global growth falls to 2% and inflation hits 6.1%. A 2% global growth rate is the threshold below which the IMF conventionally classifies conditions as a global recession.
The fertiliser and food price transmission adds further complication. The WFP estimates that the impact of energy prices on food prices could peak approximately four months following the onset of the Iran war, meaning July or August 2026. The peak consumer-facing pain arrives, if it comes, precisely at the height of the diplomatic process. That is worth noting for anyone who believes economic pressure will itself force resolution: politics and the economic pain are likely to peak simultaneously, not sequentially.
USDA estimates that corn and wheat acreage will each fall 3% in 2026 relative to 2025 as a direct result of fertiliser disruption. That reduction appears in harvest data in late summer. It appears in food price indices three to six months after that. It reaches global hunger statistics in 2027. The supply shock has not yet completed its circuit through the system, and those who are watching March CPI and seeing 3.3% are looking at the first quarter of a transmission that may take eight to 12 quarters to be fully passed through.
The analytical failure this crisis risks inducing is not panic. Panic is at least honest about the distribution of outcomes. The failure is a kind of performed optimism, driven by institutional pressure, by career incentives, by the memory of COVID and the habit of trusting policy response, and by the fundamental human preference for the clean resolution over the messy protracted outcome.
What the data actually shows is this: the largest oil supply disruption in recorded history; a physical-futures price gap signalling acute near-term stress; a fertiliser shock that will not appear in consumer prices for months; a fiscal and monetary policy toolkit that is thinner, more constrained, and less suited to a supply shock than at any point in the post-war era; a military situation with no clear exit mechanism; and a set of sovereign debt dynamics in which any attempt to paper over the damage with stimulus carries its own compounding costs.
The honest version of that picture is not that the world is certainly heading toward catastrophe. It is that the probability distribution of outcomes is materially wider and more negatively skewed than current asset prices imply. The severe scenario, global recession-level growth with 6.1% inflation, is a live possibility with material probability. It is receiving a fraction of the analytical attention that the optimistic baseline is receiving.
The direction of travel still looks troubled. The United States is not stepping back militarily. Iran has not set a date for the next round of negotiations. IRGC mines remain in the main traffic lane. The fertiliser impact on this year’s harvest is already largely locked in. The fiscal headroom to respond to the next shock, whatever form it takes, is materially diminished.
Realism is not bearishness. Realism is the discipline of matching market narratives against physical facts, political incentives, and historical behaviour. Right now, the facts do not support rose-tinted certainty.
None of this argues against hoping for peace, quite the opposite, in fact. But hope is not a strategy, and it is certainly not analysis. The great danger in moments like this is not panic. It is premature relief. Markets love closure, even when none exists. So do human beings. We prefer the clean ending, the easy reassurance, the tidy narrative that says the worst is behind us.
Investing and advising those who invest requires a colder habit of mind. We need to ask not what we would like to be true, but what is most likely to be true if present trends continue. On that test, the world still looks more fragile than the market’s recent mood suggests. The pipe has been cut. The reserves are depleting. Central banks are constrained. And the diplomacy has not produced a date for the next meeting.
Gary Dugan – Investment Committee Member
Bill O’Neill – Non-Executive Director & Investor Committee Chairman
20th April 2026
The information contained within is for educational and informational purposes ONLY. It is not intended nor should it be considered an invitation or inducement to buy or sell a security or securities noted within nor should it be viewed as a communication intended to persuade or incite you to buy or sell security or securities noted within. Any commentary provided is the opinion of the author and should not be considered a personalised recommendation. The information contained within should not be a person’s sole basis for making an investment decision. Please contact your financial professional at Falco Private Wealth before making an investment decision. Falco Private Wealth are Authorised and Regulated by the Financial Conduct Authority. Registered in England: 11073543 at Millhouse, 32-38 East Street, Rochford, Essex SS4 1DB